


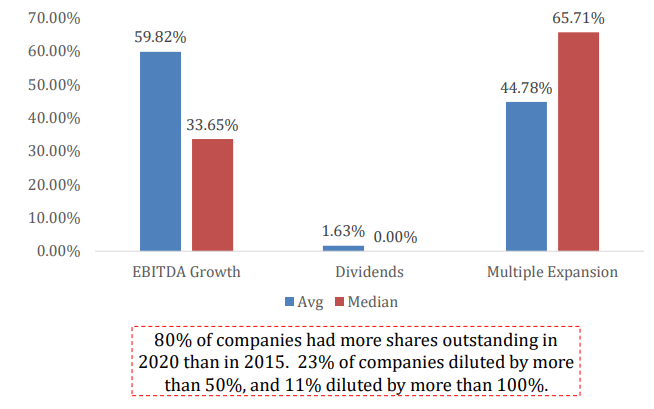
TSR Drivers (as % of TSR)
I came across a deck made by Conor Hayley over at Alta Fox Capital which breaks down in a detailed 645-page report about what drives Total Shareholder Return for 104 companies he analyzed. Considering its length, I took one chart (above) that highlighted the three key drivers that data has shown to produce outsized returns and his commentary below.
On average, EBITDA growth contributed 59.82% of TSR and multiple expansion contributed 44.78% of TSR.
However, the medians tell a different story: EBITDA growth contributed 33.65% of TSR and multiple expansion contributed 65.71% of TSR.
In general, multiple expansion and EBITDA growth played a roughly even role in driving TSR.
Dividends seldom made a major impact and only drove >10% of TSR for 2 companies.
Multiples contracted for 11 companies which muted TSR.
If you belive this information is useful (I do), I’d suggest taking a look at the full presentation below when you have a massive amount of time to focus on it.
Until next time,
Cedar Grove Capital


