


Volatility the New Normal
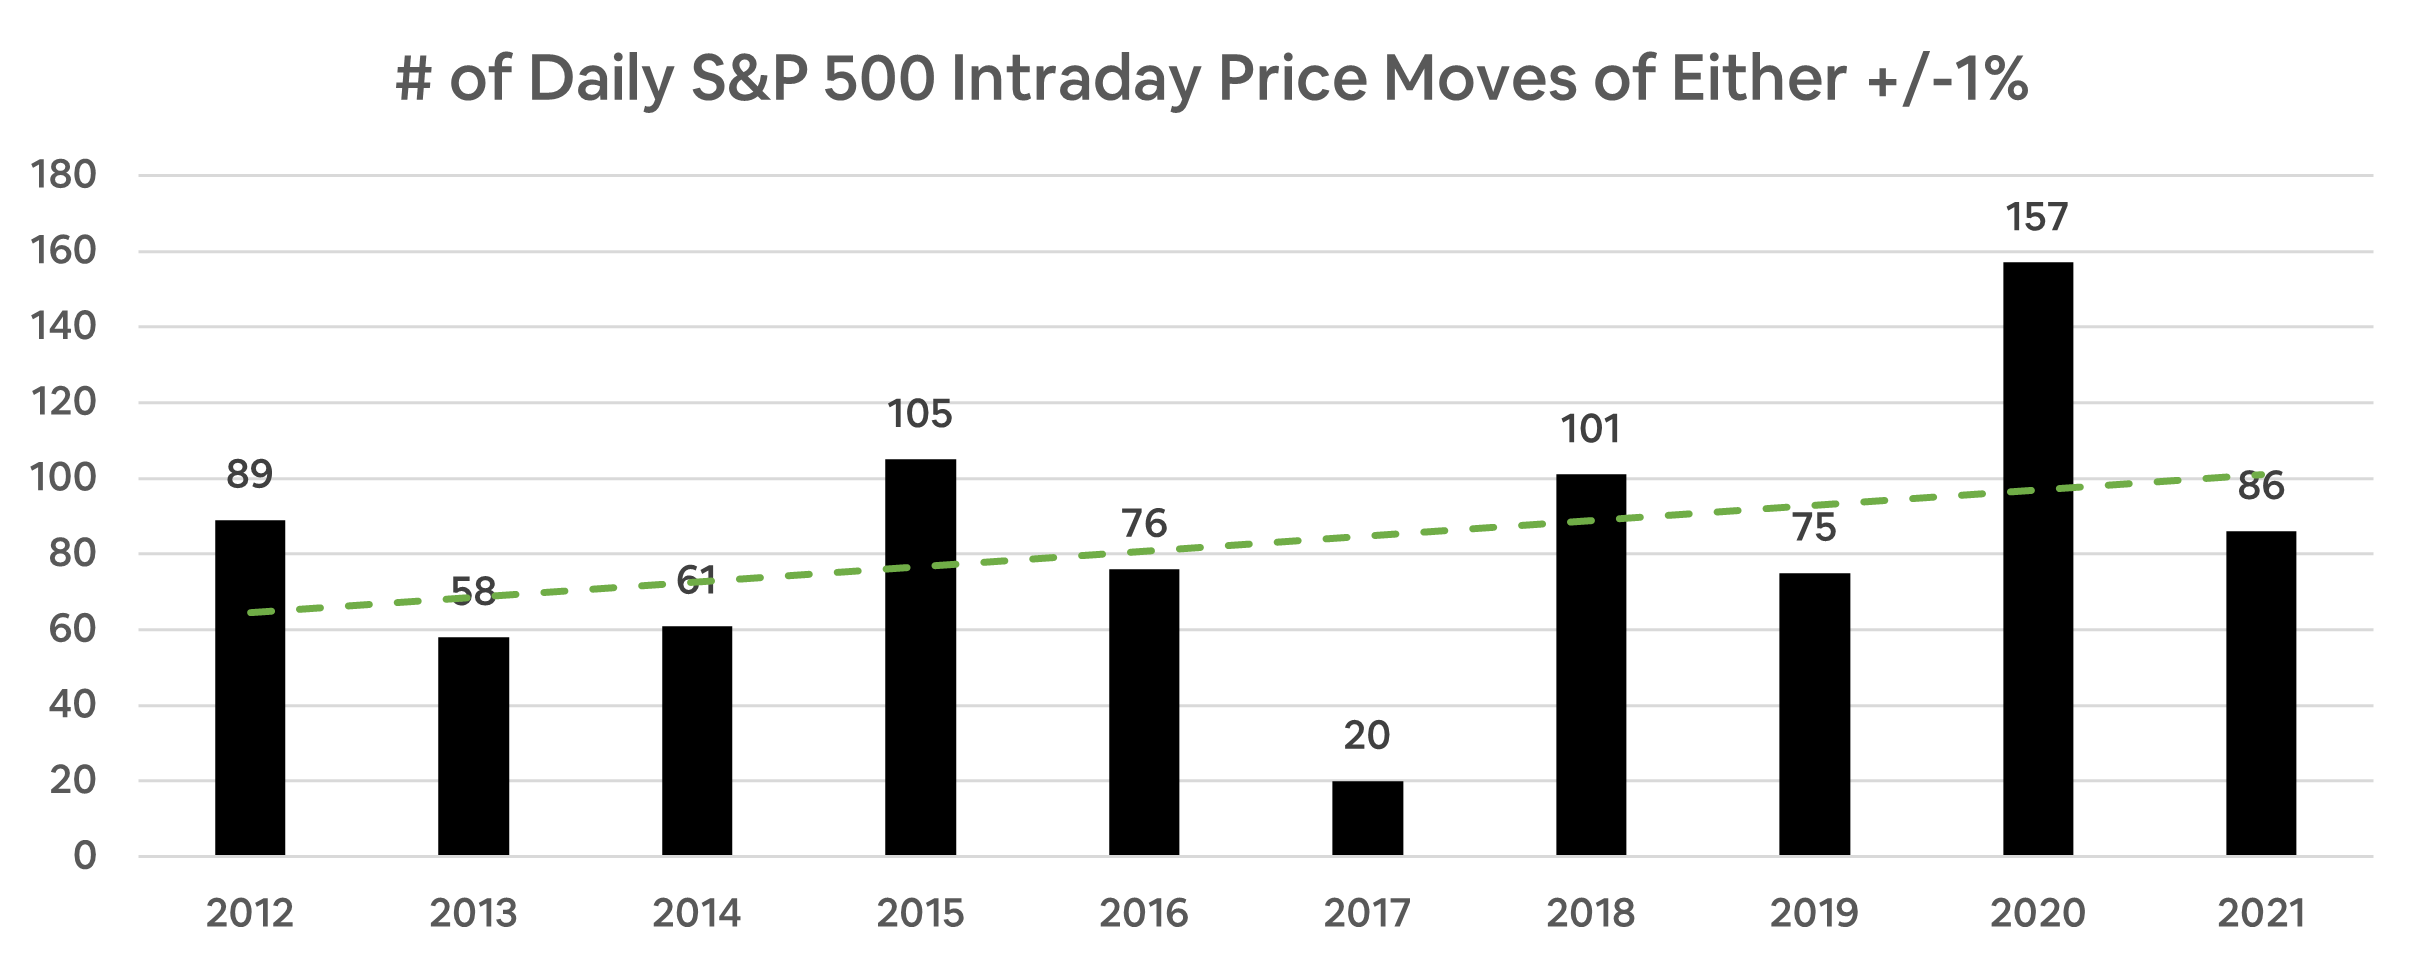
Looking at intraday percent moves of +/-1% for the S&P 500, 2020 and 2021 combined have almost more swings than 2016→2019 combined (243 vs. 272).
2020 saw 62% of its number of trading days experiencing this +/-1% intraday price swings compared to 34% for 2021.
Access to commission-free trading, more cash during COVID, and leniency of ability to borrow on margin have allowed investors to move in and out of stocks more frequently.
Since the beginning of 2020 (2020 and 2021), the average intraday price movement upwards and downwards has been at its 10-year high → +0.70% and -0.63% vs. the next highest set in 2018 of +0.59% and -0.61%.
The bottom line, be ready to endure more short-term pain and gain as more price swings will be a part of regular investing.


