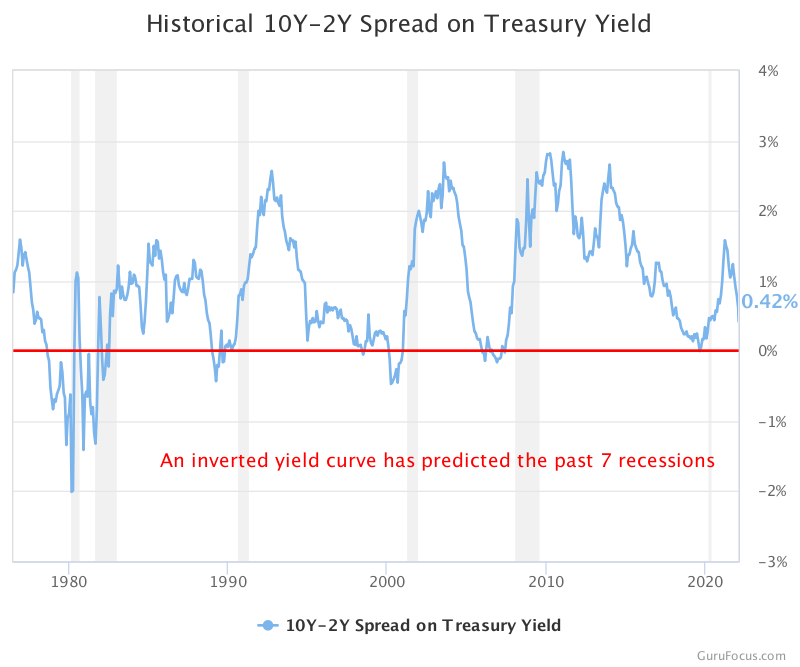
The term yield curve refers to the relationship between the short- and long-term interest rates of fixed-income securities issued by the U.S. Treasury.
An inverted yield curve occurs when short-term interest rates exceed long-term rates.
The U.S. curve has inverted before each recession since 1955, with a recession following between six and 24 months later, according to a 2018 report. It offered a false signal just once in that time.
The yield curve has been flattening over the last few months as the Federal Reserve prepares to hike rates, and some analysts are forecasting more extreme moves or even inversion.
While rate increases can be a weapon against inflation, they can also slow economic growth by increasing the cost of borrowing for everything from mortgages to car loans.
The last time the yield curve inverted was in 2019. The following year, the United States entered a recession - albeit one caused by the global pandemic.
Until next time,
Cedar Grove Capital


