


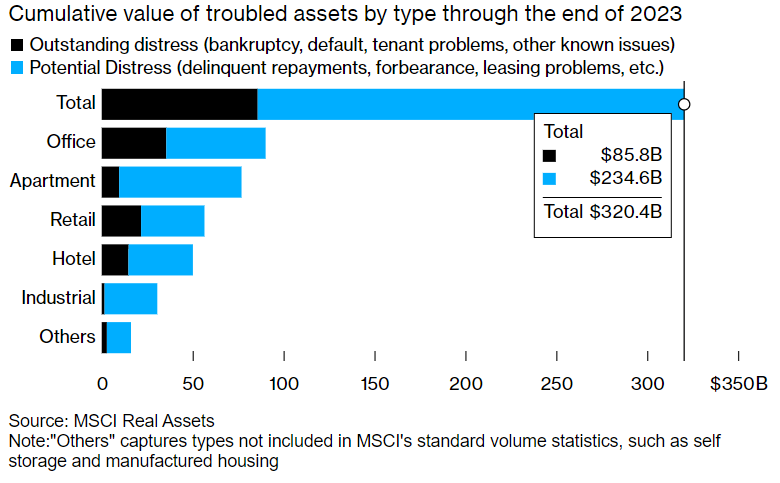
“Once a $3 trillion asset class, offices now are probably worth $1.8 trillion. There’s $1.2 trillion of losses spread somewhere, and nobody knows exactly where it all is.”
- Barry Sternlicht
The first real public domino to fall in the CRE trade was New York Community Bank NYCB 0.00%↑. In one day after the company reported $185 million in net charge-offs in the fourth quarter and cut its dividend, the stock closed down ~37%.
This sent shockwaves in the market about the rising risks associated with the current state of the CRE market. Borrowers are due to repay $929 billion of U.S. commercial real estate loans this year, and $573 billion the year after, according to the Mortgage Bankers Association.

Banks alone are holding almost $700 billion worth of paper maturing in the next 2 years with ~43% having current interest rates below 5.00% (14.7% of maturing loans in the next two years have an existing interest rate under 4.00%).
The problem that has been widely talked about over the last year is the refinances coming home to roost. Barry Sternlicht has been sounding the alarm for some time and has gone as far as calling for a backstop of these loans before an “existential crisis” takes hold.
But how bad is it? Well, Fitch forecasts overall U.S. CMBS loan delinquencies to double from 2.25% in November 2023 to 4.5% in 2024 and 4.9% in 2025.
Commercial office is the worst of them all. CMBS office delinquency rates rose progressively through 2023, beginning at 1.9% in January and ending the year at 5.8%. The rate kicked off 2024 at an even higher 6.3% and Fitch believes it will end 2024 at 8.1%.
Meanwhile CMBS loan delinquencies in commercial multifamily — housing properties with more than five units — are expected to touch 1.3% in 2024 versus 0.62% in 2023.
Despite the double in projected delinquency rates for commercial multi-family, apartment landlords are facing much different issues than office owners with a glut of space; there’s still a shortage of housing across most cities. Distress in the sector instead stems mostly from surging borrowing costs.
After investors clamored into the market in the easy-money days of 2021, spiking interest rates took a bite out of building values, just as owners needed to refinance. Rent growth has flattened since then, as developers added new apartments at the fastest clip in generations.
However, what’s making the office situation way worse is that over the last couple of years, vacancy rates and yields have been making the values of these assets crater.
The national office vacancy rate rose to a record-breaking 19.6% in the fourth quarter of 2023, according to Moody’s Analytics. That’s the largest quarterly increase since the first quarter of 2021, and larger than the 19.3% level reached twice in 40 years.
Because of this lack of paying tenants and the WFH trend continuing, properties being sold at a loss have risen dramatically since 2022.
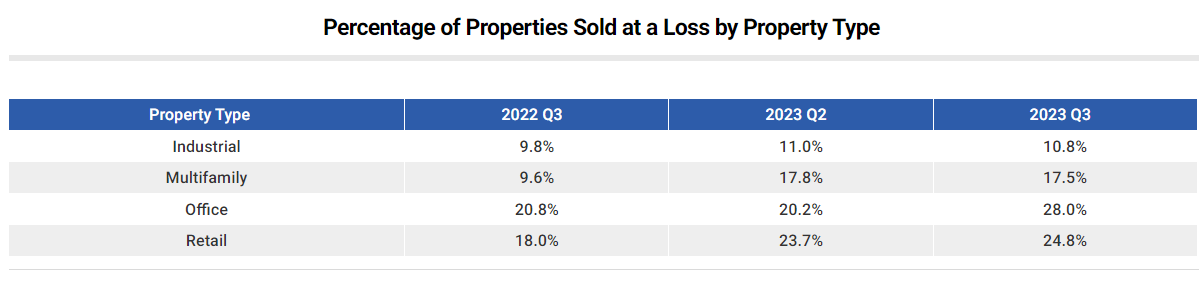
Among five of the largest states with the most office property transactions, namely California, Florida, New York, Illinois, and Arizona, there has been a consistently large uptick in the percentage of office properties sold at a loss in Q3. Collectively, these states accounted for 39% of all properties sold at a loss.
Notable transactions include 14 53rd Street in New York, which was sold at a loss of $42 million as part of its acquisition by Capstone Equities. In Arling Heights, IL which is part of the Chicago metro, 1421 W Shure Drive, originally sold for $41 million in 2018, was sold for $28 million as part of United Airlines' plan to expand its office spaces.
With so much uncertainty in investors’ ability to not only fill space but also at an attractive NOI, required cap rates have also gone up which inherently affects valuations.
To give you an example of how valuation changes based on cap rate expectations, J.P. Morgan put out a hypothetical example via the chart below.

In the chart above, our hypothetical example shows how the value of a USD 100 million office building would decline to USD 72 million if cap rates increased from 4.5% to 6.25% (holding NOI constant). If the borrower were to look at refinancing the loan at this lower valuation, keeping the loan-to-value ratio constant, the borrower would have to contribute an additional USD 18 million in equity to get the refinancing done.
This example demonstrates just how vulnerable commercial real estate is to rising rates assuming that there was no impact to NOI, which we all know is not the case.
All this brings me to my next point. With so much debt maturing over the next two years, who are the most exposed, and what’s the saving grace?
Let’s start with the latter, shall we?
1) Saving Grace
What many have hope for, and would benefit (or at least cushion the blow) holders of CRE loans, would be the Fed aggressively cutting rates. Many investors on both sides have argued that with real rates being so positive at the moment (currently 3.3%), the time to cut is now while inflation is also coming down.
Others have argued that the economy is doing more than fine and in fact, higher rates haven’t seemed to put a dent into slowing down growth. So why cut?
Based on the Fed’s projections, we’re looking at potentially 3, 25bp cuts in 2024.

The immediate saving grace is not only the Fed following through with its projections of cutting rates, but the market has gone one step further and priced in 4-5, 25bp cuts (100-125bps in total). Some sell-side have even suggested upwards of 175bps in cuts.
The issue with this is possibly that the cumulative effect of the Fed's rate hiking cycle hasn't been fully felt yet across the economy. The idea behind tighter monetary policy is to cool down inflation by reducing spending and growth, and based on the Fed's own 2% CPI target, there's still more work to do.
Even if you don’t believe in that scenario, most of the cuts are only starting to begin in the summer (presumably) and continue into 2H.
For the CRE maturing this year, refinancing options will need to be reworked or renegotiated in order to buy time with lenders (extend and pretend). Delaying also gives banks time to build reserves they’ll need to write down the value of troubled loans.
This might buy time to potentially get slightly more favorable rates during rolling time but it’s all very contingent on a) lenders agreeing to buy time, and b) the Fed following through.
It’s hard to say how much of a “sure thing” rate cuts are this year and to what degree but when you have hundreds of billions of dollars in paper relying on what one guy does, that doesn’t really bode well for the investors currently holding the bag.
2) Where’s the Exposure?
Banks provide approximately half of the total US commercial real estate debt, and most of that comes from smaller banks.
Small banks have been growing CRE lending faster than large banks. This has contributed to small banks accounting for approximately two-thirds of total commercial real estate bank loans in the US, and many with high exposures to the asset class.
According to FDIC reporting, CRE loans represented 44% of total loans made by small banks. That is in contrast to CRE loans as a percentage of total loans at the four large money center banks, which stood at 10%.

However, regional lenders account for 70% of the commercial real estate debt maturing through 2025 that’s on banks’ balance sheets, with the top 25 banks making up the rest, according to Morgan Stanley.
When diving deeper into bank-specific exposure, Bloomberg put out a chart of a list of banks with significant CRE exposure.
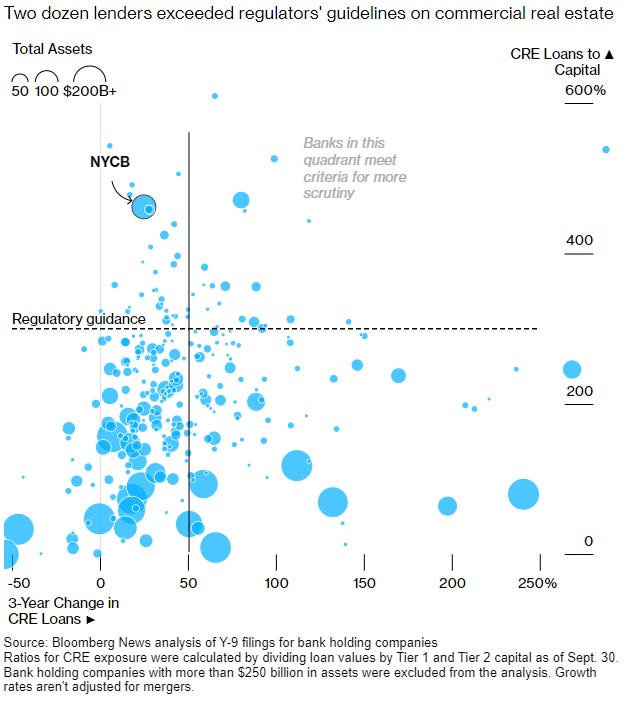
In total, nearly 1,900 banks with assets less than $100 billion had CRE loans outstanding greater than 300% of equity, according to Fitch.
Fitch, in a detailed report in December, also said if prices decline by approximately 40% on average, losses in CRE portfolios could result in the failure of a moderate number of predominately smaller banks.
So with an expectation for rate cuts and regional banks staring toward the light at the end of the tunnel not knowing if it’s a lifeline or an oncoming train.
No Systemic Risk
One thing that I want to make very clear from the start is that I do not believe this to be a systemic issue in the broader banking system. The fact is, the smallest banks in America just don’t control a large amount of the total assets floating around in the U.S.

Despite this, that doesn’t mean that regionals are safe. Hell, even J. Powell acknowledged in his "60 Minutes" interview that some smaller banks will "have to be closed" or merged "out of existence" due to losses tied to the falling values of properties across the US that are suddenly worth much less due to the Fed’s elevated interest rates and the effect of a pandemic that emptied out many city-center buildings.
There are plenty of opportunities out there for regionals with high CRE exposure but the problem with putting on this “big short” is timing. Plenty of funds over the last few years have folded while paying for premiums on swaps just waiting for CRE to collapse.
Just take a look at the 5 banks below and their YTD performance.

All have reported already and provided lackluster results and concerns going forward.
While I currently don’t have any positions in CRE at the moment, it is something that I’m actively looking into but wanted to at least share these notes with you now.
If you’re someone who has already done work and would like to exchange notes, either respond to this email or comment below.
I’d love to chat.
If you enjoyed today’s notes, please like, share, and consider subscribing.
Until next time,
Paul Cerro | Cedar Grove Capital
Personal Twitter: @paulcerro
Fund Twitter: @cedargrovecm


